
Public reporting for the STS Congenital Heart Surgery Database (CHSD) presents hospital-specific results over a 4-year period.
Operative Mortality and STAT Categories
Operative mortality (patient death) is defined as a death that occurs:
- During the hospital stay in which the procedure was performed, no matter how long the patient remains in the hospital after the operation;
- At another hospital because the patient is transferred but is never discharged; OR
- Within 30 days of the operation even if the patient is discharged home.
The mortality rate (death rate) is calculated by dividing the number of deaths by the total number of patients undergoing surgery.
Overall Rate
This rate includes patients of all ages, diagnoses, and procedures. It takes into account additional factors such as patient age, the presence or absence of genetic abnormalities, syndromes, and non-cardiac anomalies (e.g., airway or kidney anomalies), and the condition of the patient going into the operation.
STAT Mortality Categories 1-5
Congenital heart operations are grouped by the complexity of the procedure in what is known as STAT Categories. STAT Category 1 includes the least complex operations, which are associated with the lowest risk of mortality. In contrast, STAT Category 5 includes the most complex operations, which are associated with the highest risk of mortality.
| STAT Category 1 | Patch repair of Atrial Septal Defect (ASD) or Ventricular Septal Defect (VSD), pulmonic valve replacement |
| STAT Category 2 | Complete AV Canal (AVC) repair, Arterial Switch Operation (ASO) |
| STAT Category 3 | ASO + VSD repair, heart transplant, aortic arch augmentation |
| STAT Category 4 | Truncus arteriosus repair, TAPVC repair |
| STAT Category 5 | Norwood procedure, truncus + interrupted aortic (IAA) Repair |
Risk Adjustment and Case Mix
Risk adjustment allows STS database participants to compare their performance to other groups, such as the overall STS cohort, other participants, or by region or state. A participant’s case mix refers to the types of patients being treated, including their age, health conditions, how serious their heart problems are, and other factors. By accounting for and controlling patient risk factors present before surgery, risk adjustment “levels the playing field” as best as possible. Specifically, some hospitals care for more ill patients, and those patients are at greater risk of dying due to their underlying conditions, not necessarily because of the care they receive. Risk adjustment accounts for these risk factors. Unadjusted event rates are not used for these comparisons because they may be affected by variation in patient case mix and disease severity across participants.
Using risk adjustment provides a more accurate reflection of a participant’s performance relative to a reference cohort with similar patient characteristics. Direct comparisons between the risk-adjusted mortality rates of two individual participants are generally inadvisable unless their patient populations are relatively similar.
Note: If Hospital A has a lower mortality rate than Hospital B, it does not necessarily mean that Hospital A is better; it could indicate that Hospital B treated patients with more severe problems.
To account for differences in case mix, a statistical method known as risk adjustment is used to analyze results in a way that incorporates how sick the patients were before treatment. The STS CHSD Mortality Risk Model may be found online here.
How to Read the Outcomes Data Table
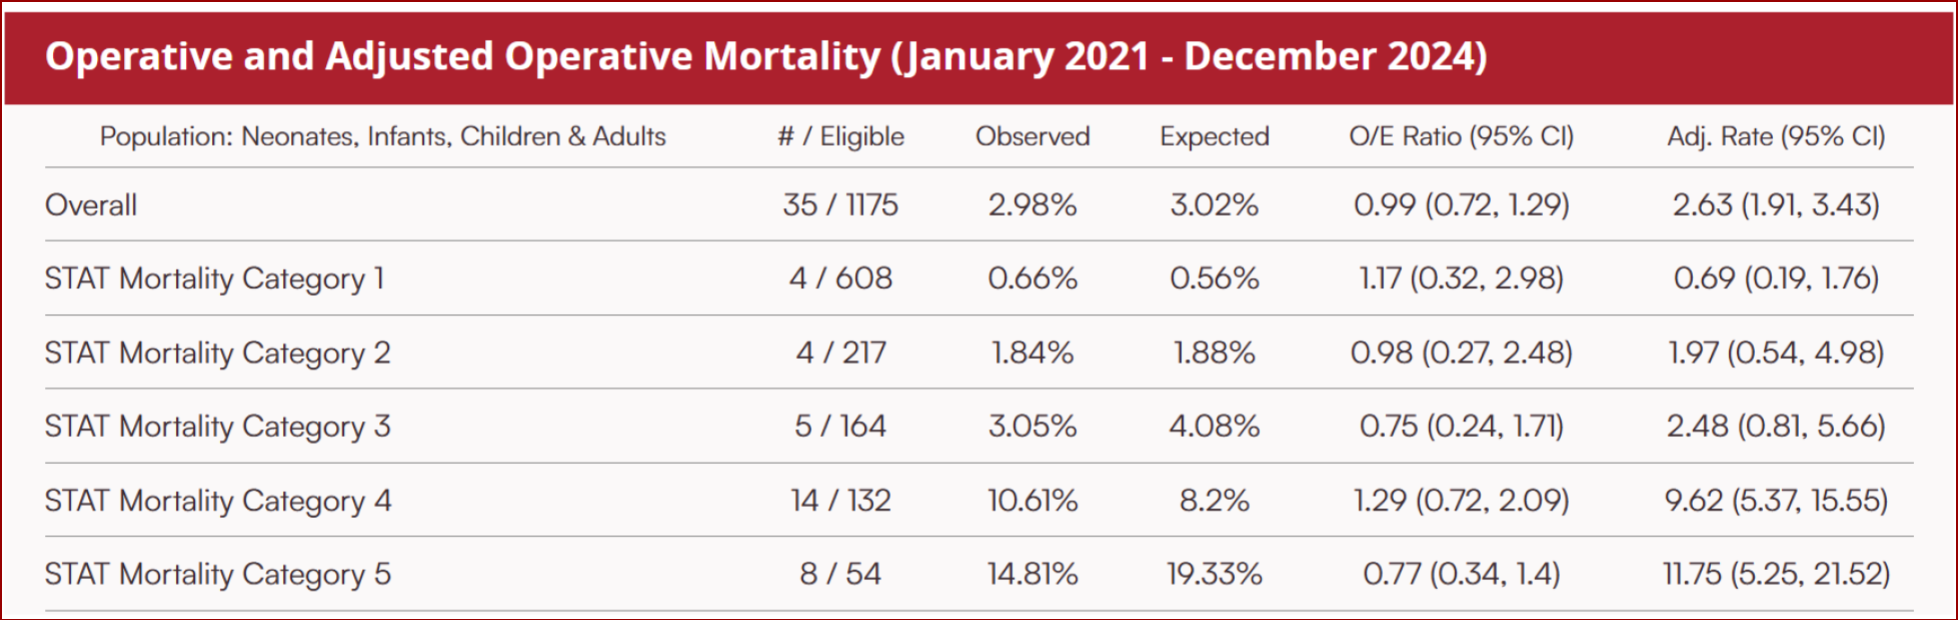
Patient Population
- Neonates (0 - 30 days)
- Infants (31 days - 1 year)
- Children (>1 year - <18 years)
- Adults (18 years and older) with congenital heart disease
Number of Patient Deaths / Eligible Patients
This is the actual number of patient deaths and the actual total number of patients included in the calculation of operative mortality. The forward slash separates the two values.
Observed
This observed operative mortality rate is the percentage of number of deaths divided by the number of eligible patients included in the calculation for each STAT Category.
Expected Number of Patient Deaths
The expected deaths represent a statistical formula that estimates the number of expected patient deaths when considering the unique case-mix of a hospital participating in the CHSD.
Observed-to-Expected Ratio (95% Confidence Interval)
The Observed-to-Expected Ratio, or O/E Ratio, is the number of observed deaths divided by the number of expected deaths.
- An O/E ratio greater than 1 means that the hospital had more deaths than expected based on the actual case mix of that hospital
- An O/E ratio of less than 1 means that the hospital had fewer deaths than expected based on the actual types of cases treated at that hospital.
Adjusted Rate (95% Confidence Interval)
The adjusted rate (adj. rate) is an estimate of what the hospital's mortality rate would be if its observed performance was applied to the overall case mix included in the CHSD. The formula is:
O/E ratio of a hospital x overall observed mortality rate for all hospitals in the CHSD
Because each hospital's mortality rate varies, confidence intervals (CIs) provide a predicted range of O/E ratios (the numbers in parentheses) that could represent a hospital's underlying true O/E ratio.
If the spread of the CI numbers is really wide, it means that the O/E ratio is a less exact estimate of the true underlying O/E ratio. In general, the width of the CI decreases as the number of patients included in the calculation increases.
If the numbers in the 95% CI (numbers in parentheses) for a participant hospital's O/E ratio are:
- Greater than 1, then the hospital has higher than expected mortality, which indicates lower than expected performance
- Overlapping with the number 1, then the hospital is performing as expected
- Less than 1, then the hospital has lower than expected mortality, which indicates higher than expected performance
Access CHSD Public Reporting results